2016年11月15日星期二

Increasement of Thermal Flow Sensor Resolution
by Oversampling with Lower Bit ADCs

Xiang Zheng Tu


As shown in the above figure, a thermal flow sensor provided by POSIFA Microsystems Company consists of a heater and two thermopiles. The sensor is heated above ambient temperature by passing a PWM output of a microcontroller through the heater and the sensor flow-dependent heat loss causes temperature changes which are converted by the thermopiles into an electrical signal. This signal is then periodically sampled and digitized by the analog-to-digital converter (ADC) of the microcontroller.

When considering the resolution required for an A/D converter (ADC) integrated in a microcontroller, embedded systems designers must balance cost and performance. Higher ADC resolution implies higher-cost microcontroller, but in some cases you can use other features in the microcontroller to enhance the ADC performance via software. That approach lets you achieve higher resolution using an inexpensive integrated ADC.

Oversampling is a process of sampling a signal with a sampling frequency significantly higher than the Nyquist rate. Theoretically a bandwidth-limited signal can be perfectly reconstructed if sampled above the Nyquist rate, which is twice the highest frequency in the signal. Oversampling improves resolution, reduces noise and help avoid aliasing and phase distortion by relaxing anti-aliasing filter performance requirements.

In our case, to implement a 12-bit converter, it is sufficient to use a 16-bit converter that can run at 256 times the target sampling rate. Combining 256 consecutive 12-bit samples can increase the signal-to-noise ratio at the voltage level by a factor of 16 (the square root of the number of samples averaged), effectively adding 4 bits to the resolution and producing a single sample with 16-bit resolution. To get the best possible representation of the analog input signal, it is necessary to oversample the signal this much, because a larger amount of samples will give a better representation of the input signal, when averaged.

Criterias for using oversampling technique are:
·       The sensor signal being measured should vary at very low frequency. Furthermore to obtain very accurate information about the dynamics of the signal, multiple harmonic components of the signal are acquired, resulting in the need to process signal bandwidths much wider than the actual signal.
·       The signal-component of interest should not vary significantly during a conversion. There should be some noise present in the signal. The amplitude of the noise should be at least 1 LSB.

Fortunately, the bandwidth of the thermal flow sensor is rather small, typically ranging from a few Hertz to a few kilohertz, high oversampling ratios can be readily employed.
Normally there are some noises present during an analog-to-digital conversion. These noises include thermal noise, noise from the CPU core, switching of I/O-ports, variation in the power supply and others, which are enough to make this method work. Another approach for satisfying the criteria is to use a method similar to a Delta-Sigma modulator, by adding a triangular wave to the input signal.

Digital Signal Processing software is required for oversampling and average. This software can be divided into five major blocks:
·       Peripheral Initialization
·       Triangular Signal Generation
·       Data Acquisition
·       Digital Filter Decimation
·       Interrupt Service Routine


A PWM output and an analog low pass filter can be used to generate a triangular signal as an additional noise signal. Reference to the above figure another PWM output of the microcontroller is used to heat the thermal flow sensor. It should be understand that the thermal inertia of the flow sensor can be modeled as a low-pass filter in the thermal domain. This may limit the response time of the flow sensor, but also remove the peak noise from the PWM output signal.

2016年11月3日星期四

MEMS Infrared Emitters
Xiang Zheng Tu

Infrared thermal emitters can be approximated as black body radiation, which is the type of electromagnetic radiation. The radiation has a specific spectrum and intensity that depends only on the temperature of the emitters. An emitter at room temperature appears black, as most of the energy it radiates is infra-red and cannot be perceived by the human eye. When it becomes a little hotter, it appears dull red. As its temperature increases further it eventually becomes blue-white.

POSIFA Microsystems Company has developed a new generation of MEMS infrared emitters that form its hot-heater based thermal flow sensors and thermal conductivity sensors. Proprietary advanced porous silicon technology combined with silicon processing result in the highest performance MEMS infrared emitters.

The MEMS infrared emitter consists of a resistive thin film platinum based heater which is positioned on a free standing thin-film stack membrane, and allows the heater to operate continuously and reliably at a higher temperature. The freestanding thin-film stack membrane thermally and electrically isolates the heater from the silicon substrate, and reduces the power consumption of the heater. In addition, the membrane has low thermal mass so that the heater is easy to modulate. The rise time of the heater is as low as 5 ms, indicating the frequency of driving pulse voltage can be up to 100 Hz.

As shown in the above figure, when the MEMS infrared emitter is operated at 300 k, the produced infrared spectrum range can be from 2 to 20 µm. This is mid-infrared spectral region containing strong characteristic vibrational transitions of many important molecules as well as two atmospheric transmission windows of 3-5 μm and 8-13 μm, which makes it crucial for applications in spectroscopy, materials processing, chemical and biomolecular sensing, security and industry.

The MEMS infrared emitters have many industrial applications including:
  • Medical (CO2 / other gases monitoring, breath /vapor analyzing),
  • Military / Law Enforcement,
  • Automotive / Transportation (breath alcohol testing / exhaust monitoring)
  • Aerospace (calibration systems, image sensing),
  • HVAC (demand controlled ventilation, refrigerant monitoring), and
  • Safety / Industrial / Environment Control (combustion gas analyzers, gas detection, air pollution). 

In the above figure the key components of an infrared greenhouse gases measurement system are infrared emitter, measurement chamber, interference filter, and infrared detector. Infrared radiation is directed from the infrared emitter through the measured greenhouse gases to the infrared detector. An interference filter located in front of the detector prevents wavelengths other than that specific to the measured gases from passing through to the detector. POSIFA Microsystems Company can provide not only infrared emitters, but also interference filters and infrared detectors. The interference filter is made of multi porous silicon layers and the infrared detectors are thermopile type.

2016年10月21日星期五

Precise Water Delivery System for Coffee Machines
Xiang Zheng Tu

 
The above figure shows a precise water delivery system for coffee machines, which is provided by POSIFA Microsystems Company. The system comprises a cold water inlet, a water filter, a solenoid valve, a thermal flow sensor module, a one-way valve and a water heater. The cold water may be supplied by running water or a water container in which water flow is driven by water self weight. The cold water enters the inlet and then successively passes through the solenoid valve, the thermal flow sensor module, the one-way valve. Finally the cold water is heated in the water heater and the hot water is ready to flow into a spray head, and onto a ground coffee, which is contained in a brew basket mounted below the spray head.

On or off of the cold water flow is realized by the solenoid valve. The valve is controlled by an electric current through a solenoid. If the valve is open when the solenoid is not energized, then the valve is termed normally open (N.O.). Similarly, if the valve is closed when the solenoid is not energized, then the valve is termed normally closed. The solenoid is controlled by a switched circuit. A digital output is connected to the base of a transistor which controls the current to a normally open relay. When the relay coil is energized, it closes the contacts, which allows current from the DC supply to flow through the solenoid. When the solenoid coil is energized, the valve opens, allowing cold water to flow through the valve.


The digital output is send by the thermal flow sensor module. The thermal flow senor module measures the flow rate of the cold water and calculates an amount of cold water flowing through in a certain time by integration, which should equal to a desired amount of cups of finished coffee to be made. When the corresponding digital output matches the number of cups, the control circuit is open to the solenoid valve thus closing the valve and stopping the flow of cold water. As seen in the above figure, there is another similar circuit for controlling the water heater. Likewise, at the same time, another digital output is sent to the contactor of the circuit for shutting down the power supply to the water heater.


The thermal flow sensors of the module rely on the ability of fluid flows to affect thermal phenomenon by way of heat transfer that, in turn, is transduced into a varying electrical signal capturing the sensor response to flow change. The sensors are thermally isolated so only heat transfer due to flow can occur. Other heat transfer pathways such as through substrate or electrical leads result in thermal losses that degrade sensor performance and are minimized in the device design. The thermal flow sensors measure mass flow rate and response is independent upon a constant fluid temperature. 

2016年10月12日星期三

Humidity Compensated MEMS Air Mass Flow Meters
Xiang Zheng Tu

Mass flow rate of air entering a fuel-injected internal combustion engine is necessary for the engine control unit (ECU) to balance and deliver the correct fuel mass to the engine. Air mass flow rate varies with the ambient absolute humidity, which means that a mass flow sensor should be in injunction with a humidity sensor for determining the quantity of intake air in each cylinder. That is hwy POSIFA Microsystems Company provides humidity compensated MEMS air mass flow meters.

The humidity compensated MEMS air mass flow meter is located ahead of a throttle body. After an air filter, the meter utilizes a MEMS thermal conductivity sensor measures the absolute humidity of air entering the throttle body. Then the entered air passes through a MEMS thermal mass flow sensor, which is incorporated in the same body and is used to measures the air mass flow rate. A microcontroller of the meter processes the data collected by the two sensors and provides a humidity compensated air (or dry air flow rate) to ECU.  

The combustion of gasoline or octane in pure oxygen follows this reaction:

2 C8H18 + 25 O2 → 16 CO2 + 18 H2O                                                 (1)

This is so-called “on ratio” or “stoiechiometric” combustion. Molecular weights of the above reagents are C8H18 = 114, O2 = 32, CO2 = 44, H2O = 18. The ratio of mass of oxygen to mass of octane is 25 x 32 / mol / 2 x 114 /mol = 3.51, which means that 1 kg of octane reacts with 3.51 kg of oxygen to produce 3.09 kg of carbon dioxide and 1.42 kg of water.

By volume, dry air contains 78.09% nitrogen, 20.95% oxygen, 0.93% argon, 0.04% carbon dioxide, and small amounts of other gases. Air also contains a variable amount of water vapor, on average around 1% at sea level, and 0.4% over the entire atmosphere.
So in dry air the reaction is expressed as:

2 C8H18 + 25 (O2 + 3.7 N2) → 16 CO2 + 18 H2O                                (2)

The ratio of mass of air to mass of octane is 12.99. Therefore for octane, the dry air–octane mixture is 12.99 i.e. for every one gram of octane 12.99 grams of air is required.

Combustion process never runs stoichiometric. It always incorporates a modest amount of excess air - 10 to 20% more than needed to burn the gasoline completely.
If insufficient amount of air is supplied to engine, unburned fuel, soot, smoke, and carbon monoxide are exhausted from the engine. The results are heat transfer surface fouling, pollution, lower combustion efficiency, flame instability and a potential for explosion.

Like all thermal mass flow meters, humidity affects their output. Sine water vapor is added to the dry air, the total mass is increased and both the overall thermal conductivity and overall viscosity change. To correct the mass flow readings of the meters what percentage of the water vapor should be know.

The thermal flow sensor of the humidity Compensated MEMS air mass flow meter consists of a thermal insulating base, a resistive heater and two thermopiles. The heater is structured as a long stripe extending from one side of the base to the opposite side and the hot junctions of the two thermopiles are arranged along the two opposite sides of the heater respectively. The cold junctions of the two thermopiles are arranged along the two opposite edges of the base. As air flows by the sensor, molecules of the flowing air transport heat away from the sensor, the sensor cools, and energy is lost, which is governed by the equation as

Qt = ΔT [ k + 2 (k Vv ρ π d Vavg)1/2 ]                                                  (3)

Where:
qt = rate of heat loss per unit time
ΔT = mean temperature elevation of the thermal insulating base
d = width of the resistive heater
k = thermal conductivity of the air passing through the sensor
Cv = specific heat of the air passing through the sensoe
Ρ = density of the air passing through the sensor
Vavg = average velocity of the air passing through the sensor

In this equation, ρ, Vavg, qt, and ΔT are the unknowns, because they change with time while the other variables are known. However, qt and ΔT can be obtained through measuring devices, leaving in the product of ρ and Vavg and cross section area of the pipe.

The thermal conductivity sensor the humidity Compensated MEMS air mass flow meter is the same as the thermal flow sensor except that the thermal insulating base is replaced by a plate suspending over a cavity. The cavity is filled with a measured humidity air and by conduction the humidity air transports heat away from the sensor.

According to the Wassiljewa Equation the thermal conductivity of a humidity air can be expressed as:

kh = xd kd / (xd Ad + xw Aw) + xw kw / (xd Ad + xw Aw)                          (4)

Where:
xd  = mole concentration of dry air
xw = mole concentration of water vapor
kh = thermal conductivity of humidity air
kd = thermal conductivity of dry air
kw = thermal conductivity of water vapor
Ad, Aw = constants to be specified
It could be convenient to use linear least squares method for anglicizing the measurement data of the thermal conductivity sensor. The regression model can be expressed as:

Vout = β xd + βw xw                                                                                (5)

xd + xw = 1                                                                                             (6)

Where Vout is the output of the thermal conductivity sensor, β and βw are constants to be specified by experiments. 

Assuming:
mh = mass flow rate of humidity air which is measured by the thermal flow sensor
mw = mass flow rate of water vapor which is calculated using absolute humidity measured by the thermal conductivity sensor
The following expression can be established:

md = mh – mw                                                                                                         (7)

Where md = mass flow rate of dry air which is required by all combustion engines.

In conclusion, POSIFA Microsystems Company provides humidity compensated MEMS air mass flow meters which combine air flow rate and absolute air humidity measurements and directly output dry air flow rate without adding temperature and pressure measurements.

2016年10月5日星期三


Natural Gas Calorific Meter with Two MEMS Sensors
 Xiang Zheng Tu

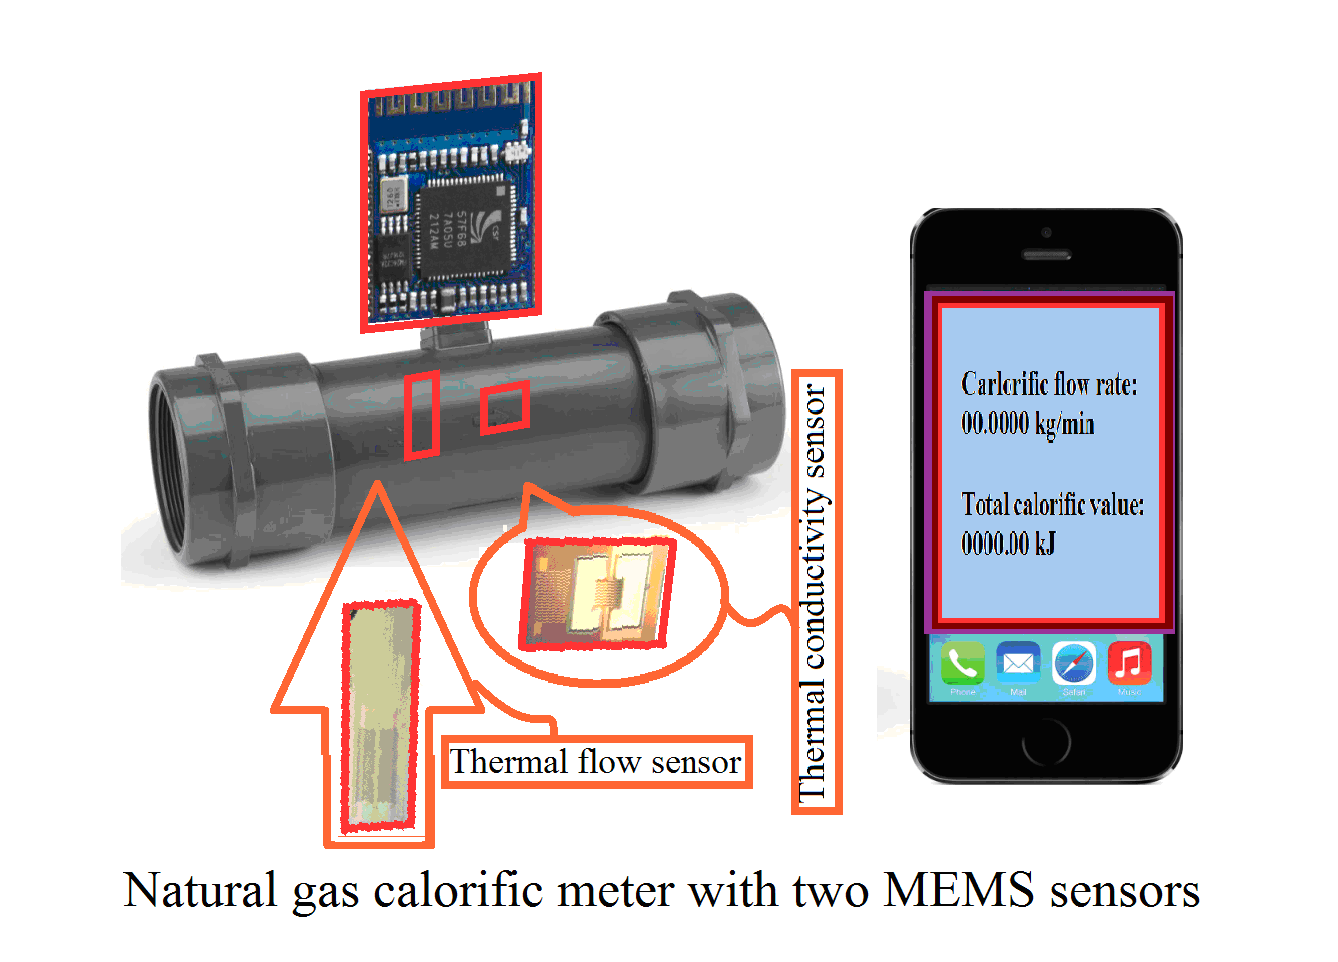
As shown in the above figure, a MEMS natural gas calorific meter mainly comprises a MEMS thermal flow sensor and a MEMS thermal conductivity sensor. The thermal flow sensor measures natural gas mass flow rate. Natural gas is a naturally occurring gas mixture, consisting of methane, ethane, propane and nitrogen. The thermal conductivity sensor measures the mole percentage of methane, ethane, propane and nitrogen in the natural gas flow. With the measured mass flow rate and each composition mole percentage the calorific flow rate and total calorific value displayed on the smart phone in the above figure can be calculated.

With the state-of-the-art electronics for the signal process, MEMS natural gas calorific meters have extended dynamic range, enhanced data safety and are easy for network and remote data transmission. They have automatic temperature and pressure compensation and directly provide calorific value. As the MEMS sensor is miniature, the sensor assembly including the electronic control board can be designed into a compact form that is substantially smaller than the mechanical counterpart. This could benefit for the reduction of the cost not only in manufacture but for overall gas distribution management.

The composition of natural gas can be determined based on the fact that the temperature curve of the thermal conductivity coefficient is unique for each natural gas mixture, but highly correlated. A multiple linear regression can be used to model the relationship between two or more explanatory variables and a response variable by fitting a linear equation to observed data. The model can be expressed as:

Y = β0 + β1 xEthane + β2 xPropone +β3 xNitrigen                                                               (1)

xMethane + xEthane + xPropone  + xNitrigen= 1                                                                  (2)

Where Y is the sensor signal output, β0, β1, β2, β3 are the parameters of the regression equation, and xMethane,  xEthane,  xPropone ,  xNitrigen are each component mole fraction of natural gas.

These equations describe how the mean response Y changes with the explanatory variables. The observed values for Y vary about their means y and are assumed to have the same standard deviation σ. The fitted values estimate the parameters β0, β1, β2, β3 of the regression equations. Since the observed values for y vary about their means Y, the multiple regression models include a term for this variation. In words, the model is expressed as DATA = FIT + RESIDUAL, where the "FIT" term represents the expression β0 + β1 xEthane + β2 xPropone +β3 xNitrigen . The "RESIDUAL" term represents the deviations of the observed values y from their means Y, which are normally distributed with mean 0 and variance σ. The notation for the model deviations is ɛ.

The thermal conductivity sensor is excited using three voltage steps V1, V2, V3, resulting in three different operation temperatures. Each operation temperature or driving voltage results a multiple linear regression as follows:

Yv1 = β0v1 + β1v1 xEthane + β2v1 xPropone +β3v1 xNitrigen                                                  (3)

Yv2 = β0v2 + β1v2 xEthane + β2v2 xPropone +β3v2 xNitrigen                                                 (4)

Yv3 = β0v3 + β1v3 xEthane + β2v3 xPropone +β3v3 xNitrigen                                                  (5)

With measured Yv1, Yv2, Yv3, and estimated parameters β0v1……β3v3, the composition mole percentage of a natural gas coming from different sources can be determined in this way: First the sensor is excited by the three voltage steps V1, V2, V3 and each results a sensor signal outputs;
Then the three equations can be obtained for each exciting voltage;
Finally the equations are solved to find each mole fraction of the measured natural gas.

The calorific value of natural gas can be further calculated using the above measured data as flows:

Calorific flow rate =
(ṁ GMethane) (HVMethane) + (ṁG ethane2) (HVEthane) + (ṁ GPropone) (HVPropone)          (6)                                  

GMethane = MWMethne  xMethane / (MWMethne  xMethane +MWEthane  xEthane
+MWPropone  xPropone +MWNitrigen  xNtrigen  )                                                                 (7)

GMethane = MWEthane  xEthane/ (MWMethne  xMethane +MWEthane  xEthane
+MWPropone  xPropone +MWNitrigen  xNtrigen  )                                                                (8)

GMethane = MWMethne  xMethane / (MWMethne  xMethane +MWEthane  xEthane
+MWPropone  xPropone +MWNitrigen  xNtrigen  )                                                                (9)

Where: ṁ = mass flow rate measured by the thermal mass flow sensor, in b/min
HVn = heating value of gas component n, in BTU/SCF
xn = mole fraction of gas component n. The table below contains the list of individual component LHV & HHV.
MW = Molecular weight of gas component n.


The higher heating value (HHV) refers to a condition in which the water is condensed out of the combustion products. The higher heating value includes the sensible heat and latent heat of vaporization especially for water. In other words, HHV assumes all the water component is in liquid state at the end of combustion.


The lower heating value (LHV), on the other hand refers to the condition in which water in the final combustion products remains as vapor (or steam); i.e. the steam is not condensed into liquid water and thus the latent heat is not accounted for.  The LHV assumes that the latent heat of vaporization of water in the fuel and the reaction products is not recovered. 

2016年9月17日星期六

Porous Silicon Multilayer Infrared Bandpass Filters
Xiang Zheng Tu
 
Nowadays many people with diabetes need to measure their blood glucose levels by pricking their fingers, squeezing drops of blood onto test strips, and processing the results with portable glucometers. The process can be uncomfortable, messy and often has to be repeated several times every day.

In order to help improve the lives of millions of people by enabling them to constantly monitor their glucose levels without the need for an implant, non-invasive measurement approaches of blood glucose concentration based on absorption measurements in the infrared region have been explored many years. Among them is a micro-optical-mechanical-electro-system (MOMES)-based non-invasive blood glucose monitor designed by the present author ten years ago, as shown in the above figure.

The monitor comprises a micromachined infrared optical filter array, a micromachined infrared mechanical modulator array, at least one micromachined infrared tunable filter, and at least one infrared detector. Each optical filter is aligned with a mechanical modulator along its optical axis direction. The optical filter continuously divides a monochromatic infrared light in a wavelength range within 0.8 to 25 micron from an infrared light. The aligned mechanical modulator turns the monochromatic infrared light into an alternating monochromatic infrared light. The tunable filter is aligned with the infrared detector along its optical axis direction. The tunable filter selects the back-diffused alternating monochromatic infrared light emitted from a measured blood subject that is illuminated by the alternating monochromatic infrared light. The infrared detector converts the back-diffused alternating monochromatic infrared light into an alternating electronic signal. Then a photo-integrated circuit (IC) combines with the infrared detector for synchronous detection and amplification of the electronic signal generated by the synchronous detection.

The micromachined infrared optical filter could be a porous silicon multilayer infrared pass band filter, reference to the above figure. The basis of the porous silicon filter is the same as in a common interference filter. The main difference is that in the porous silicon filter the difference in refractive indices is caused by different porosities of porous silicon layers, not different layers of different materials as in common interference filters. The porous silicon multilayers are produced by changing one of the etching parameters periodically. Etching parameters that affect the morphology and pores’ depth are current density, electrolyte composition, sample’s doping, etc. Once a porous silicon layer is formed anodization stops in this layer and only proceeds in pore tips. The porosity of layers depends only on current density when other etching parameters are kept fixed so that changing the current density results in layers with different porosities in depth of sample.

The porous silicon multilayer shown in the above figure can be expressed as:

(LH )mLL (HL)m-1 H                                                                                (1)

where L denotes a layer with low refractive index and H denotes a layer with high refractive index, m is the numbers of repeating periods. Optical thickness of L and H Layers in bandpass interference filter should be equal to one fourth of peak wavelength: 

nLdL = nHdH = λp/4                                                                                   (2)                                                               
where nL is  refractive index and dL physical thickness of L layers, similarly nH and dH correspond to H layers, and λp is a peak wavelength. 
The effective refractive index of porous silicon layer, n, depends on its porosity. The refractive index is almost a linear function of porosity. Bruggeman approximation is used to determine the effective refractive index of porous silicon layer:  
n = (1 - p) ( ɛsi - ɛpsi ) / (ɛsi + 2 ɛpsi ) + p (ɛair – 2 ɛpsi ) / (ɛair + 2 ɛpsi )         (3)
where p is the porosity, and ɛair, ɛsi, ɛpsi are the dielectric constants of air, silicon, and porous silicon, respectively.

The infrared light source shown in the above figure could comprise a resistive heater positioned on the top of a membrane suspending over a cavity. All theses elements of the device are constructed as a microstructure and integrated with the porous silicon multilayer infrared bandpass filter in a same silicon substrate. As can be seen in the figure the collimator is also formed in the silicon substrate and positioned along the extending direction of the light source and the porous bandpass filter. In this way the micro-optical-mechanical-electro-system (MOMES)-based non-invasive blood glucose monitor can be small in size, light in weight, compact in structure and low in power consumption. 

2016年9月8日星期四

MEMS Optical Fabry–Pérot Switches
Xiang Zheng Tu
 
Ten years ago, the present author designed a MEMS optical switch array for DNA synthesis and detection, as shown in the figure 1.  A MEMS optical Fabry-Perot switch consists of a silicon substrate, a cavity and a driving circuit. The cavity is formed by a deflectable plate and a fixed plate which are separated by an air gap. The plates are constructed by dielectric thin films coated with a metal film on their opposite surfaces. The dielectric plates are transparent in the wavelength ranges 350 nm – 14000 nm. The metal films are used as both optical reflecting mirrors and electrodes connecting to the driving circuit. The air gap can be changed by applying the voltage between the two plates resulting in an electrostatic force which pulls the plates closer.

 
The principle of operation of the optical switch is illustrated in the figure 2. The input signal is incident on the left surface of the cavity. After one pass through the cavity a part of the light leaves the cavity through the right facet and a part is reflected. A part of the reflected wave is again reflected by the left facet to the right facet. If the air gap is equal to half an even multiple of the wavelength in the cavity a round trip through the cavity will be an integral multiple of the wavelength. In this case all the light waves will transmit through the right facet add in phase. Such wavelengths are called the resonant wavelengths of the cavity and the optical switch is in “on” state. Similarly, if the air gap is equal to half an odd multiple of the wavelength all the light waves will reflect by the cavity and the optical switch is in “off” state.

Optical Fabry-Perot cavities based on micro electro-mechanical systems (MEMS) are an enabling technology for hyper spectral images and micro spectrometer. MEMS optical switches are high pass filters that block the visible light and pass ultraviolet light. They are characterized by their bandwidth at which maximum transmission is 50%. A MEMS optical switch array consists of a Cartesian grid of switches. This can be used chiefly to map or "encode" the coordinate of each switch to its function. Switches in these arrays typically use a universal signal ling technique (e.g. fluorescence), thus making coordinates their only identifying feature.


Additional features of the MEMS optical switch array for DNA synthesis and detection are combination of DNA synthesis and detection, high probe density and low fabrication cost. Such DNA probes with a MEMS optical switch array can help to dramatically accelerate the identification of the estimated 80,000 genes in human DNA, an ongoing world-wide research collaboration known as the Human Genome Project. The DNA probes can quickly sequence DNA. In addition to genetic applications, the DNA probes can be used in toxicological, protein, and biochemical research. The DNA probes can also be used to rapidly detect chemical agents used in biological warfare so that defensive measures can be taken.